Data
Visualization
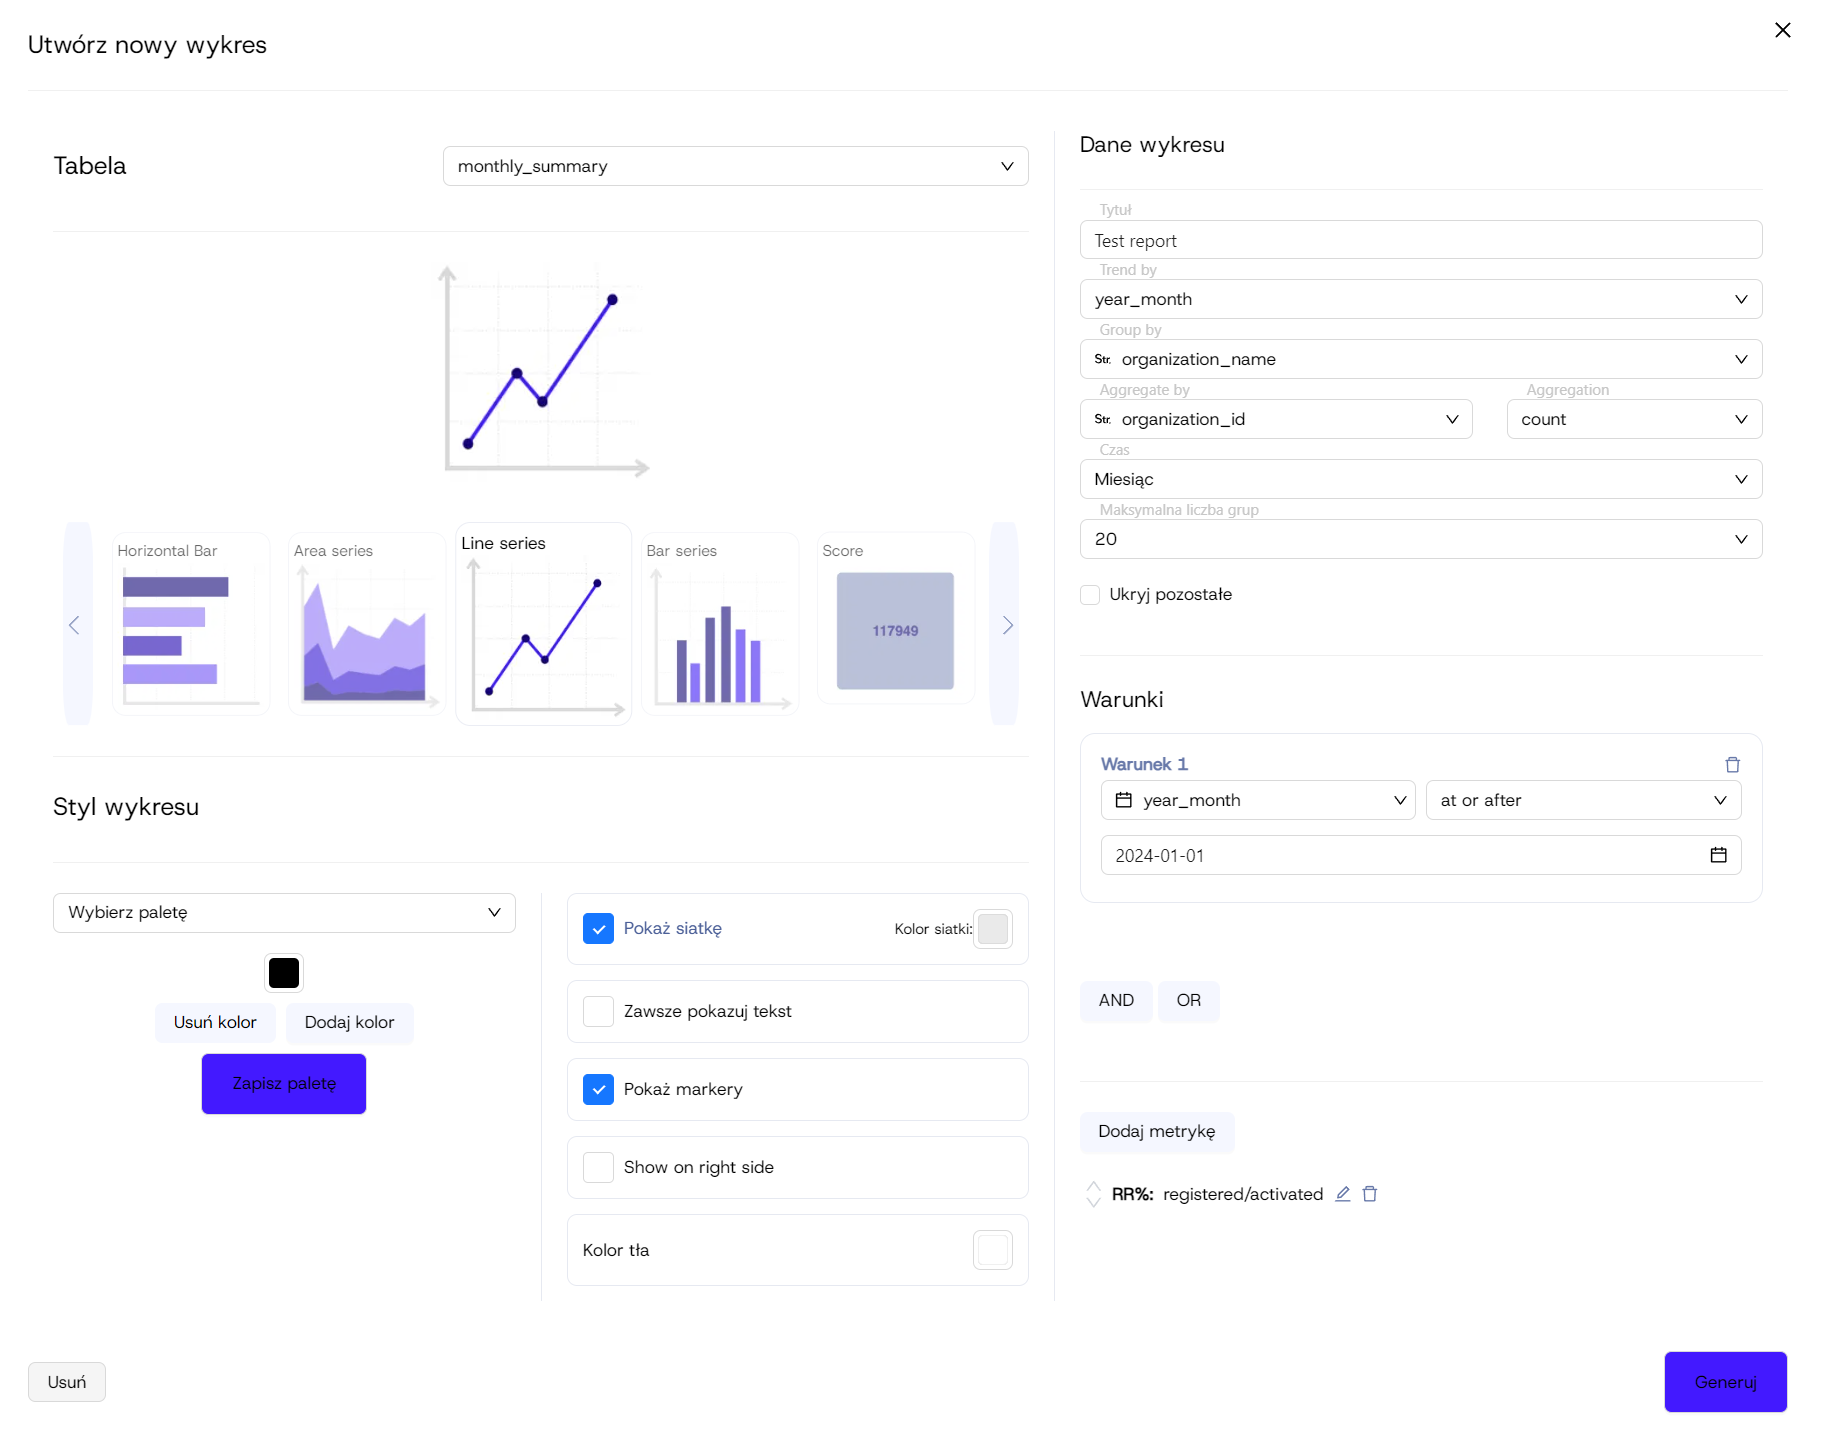
The ‘data-driven’ approach involves making decisions based on key data rather than intuition — that’s why clear data presentation is a core feature of the Echo Analytics platform.
Transform complex datasets into visual stories that make sense instantly. With our Business Intelligence tools, even non-technical users can explore data, spot trends, and act faster. Visual dashboards help managers track team performance, detect bottlenecks, and drive improvements — all in one view.
Smart visualisation speeds up understanding and drives precise, confident decisions.